Mastering Visual Strategy: A Guide to Business Vector Infographic Templates for Roadmaps and Workflows
In the fast-paced world of modern business communication, clarity is currency. Whether you are pitching a startup concept to investors, outlining a quarterly strategy to stakeholders, or teaching a complex process to new employees, the ability to visualize information is just as important as the data itself. This is where the business vector infographic template becomes an indispensable asset. Far from being mere decoration, these design frameworks serve as cognitive bridges, transforming abstract ideas into tangible, understandable narratives.
For general readers and professionals alike, understanding how to leverage these templates—specifically those designed for creative roadmaps, five-step processes, and workflow layouts—can dramatically improve engagement and retention. This guide explores the foundational elements of vector-based business design, explaining why specific formats like EPS and SVG matter, and how to effectively utilize blank presentation design elements with text space to tell a compelling story.
The Foundation: Why Vector Graphics Matter in Business
Before diving into specific layouts, it is crucial to understand the medium. When you download a professional template package containing EPS, JPG, PNG, and SVG files, you are accessing different tools for different stages of your workflow. However, the core value lies in the vector formats (EPS and SVG).
Unlike raster images (JPG/PNG) which are made of pixels and lose quality when enlarged, vector graphics are built on mathematical paths. This distinction is vital for business presentations. A roadmap displayed on a laptop screen must look equally crisp when projected onto a conference room wall or printed on a large-format poster. Vector templates ensure that your lines remain sharp and your text remains legible at any scale. Furthermore, because vectors are essentially code-driven shapes, they allow for infinite customization without degradation, making them the industry standard for scalable corporate identity and data visualization.
Decoding the File Formats in Your ZIP
- EPS (Encapsulated PostScript): The industry standard for print and professional editing. Best used in Adobe Illustrator for deep customization.
- SVG (Scalable Vector Graphics): Web-native vector format. Ideal for interactive websites, responsive dashboards, and digital-only presentations.
- PNG: Raster format with transparency support. Perfect for dropping pre-rendered icons or charts into PowerPoint or Keynote without white backgrounds.
- JPG: Compressed raster image. Useful for quick previews, email attachments, or social media sharing where file size matters more than editability.
The Creative Roadmap: Visualizing the Journey
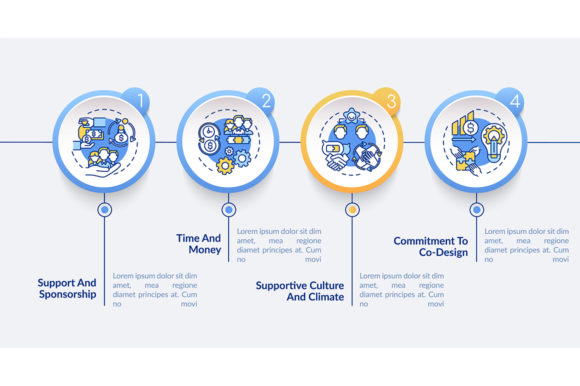
One of the most sought-after assets in business design is the business vector infographic template for creative roadmap. A roadmap is distinct from a standard timeline; while a timeline simply marks chronological events, a roadmap implies strategic intent, milestones, and future vision. It answers the question, "Where are we going, and how will we get there?"
When utilizing a roadmap template, the visual metaphor is key. Effective templates often use winding paths, ascending mountains, or connected nodes to suggest progress rather than just duration. For beginners, the mistake often lies in overcrowding these visuals. A creative roadmap should highlight major phases rather than daily tasks. By using templates with ample copyspace, you force yourself to distill complex strategies into digestible checkpoints. This constraint actually enhances communication, ensuring your audience grasps the high-level strategy before diving into the granular details.
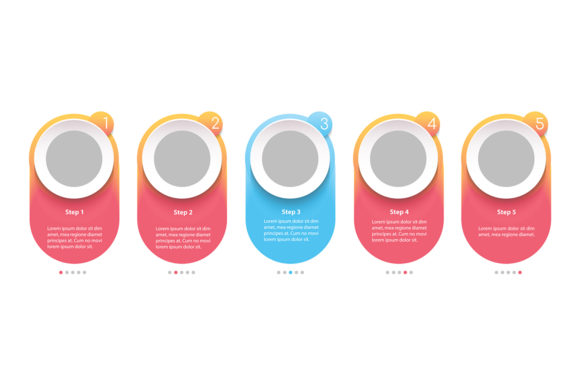
Structuring Logic: Data Visualization with 5 Steps
Cognitive psychology suggests that human working memory has limits. The "Rule of Five" is a prevalent concept in instructional design and marketing because it strikes a balance between simplicity and comprehensiveness. A data visualization with 5 steps template provides a pre-validated structure for breaking down processes, benefits, or methodologies.
Consider how this applies across different sectors:
- Onboarding: Application → Screening → Interview → Offer → Orientation.
- Product Development: Ideation → Prototyping → Testing → Refinement → Launch.
- Customer Service: Contact → Assessment → Solution → Verification → Feedback.
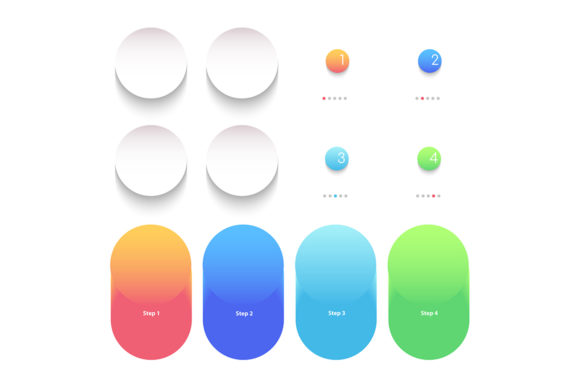
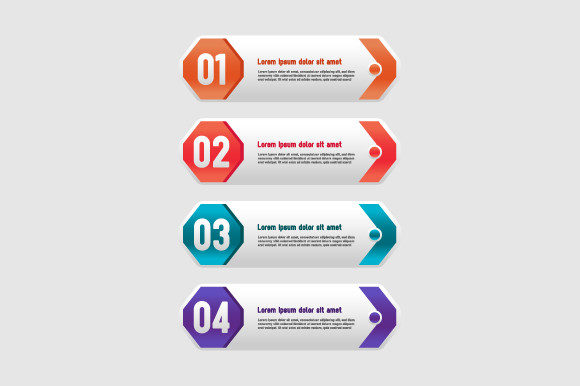
Using a dedicated 5-step vector template removes the friction of layout design. Instead of wrestling with alignment tools, you can focus entirely on the accuracy and tone of your content. These templates typically feature numbered badges, connecting arrows, or circular diagrams that guide the eye naturally from left to right or top to bottom, reinforcing the sequential nature of the information.
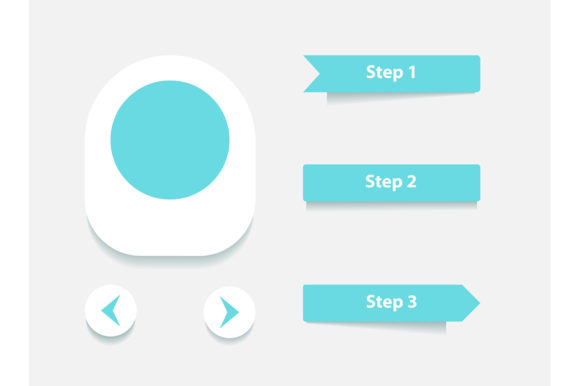
The Importance of Blank Presentation Design Elements
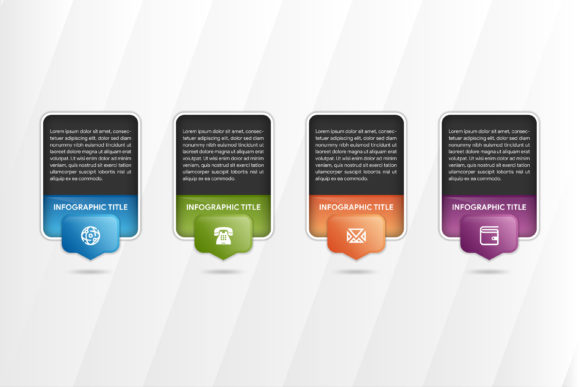
A common misconception is that a template must be fully illustrated to be useful. In reality, blank presentation design elements with text space are often more valuable for bespoke projects. These modular components act as building blocks. You might need a header bar from one template, a 5-step process from another, and a footer from a third.
Templates with generous copyspace respect the hierarchy of information. They acknowledge that in business communication, the text carries the weight of authority, while the graphic provides the context. If a template is too visually dense, it competes with your message. Professional-grade vector assets prioritize negative space, allowing your typography to breathe and your key takeaways to stand out against the background.
Workflow Layouts: Mapping Efficiency and Clarity
While roadmaps show destination and 5-step charts show sequence, workflow layouts demonstrate relationship and dependency. These are critical for operational documentation, software architecture explanations, and supply chain management. A workflow layout differs from a linear timeline because it often includes decision points, feedback loops, and parallel processes.
When selecting a workflow template, look for clear visual differentiation between action items (usually rectangles), decisions (diamonds), and start/end points (ovals). The best vector templates adhere to universal flowchart standards while applying modern aesthetic sensibilities. This ensures that technical teams recognize the logic immediately, while non-technical stakeholders appreciate the clean, professional appearance.
Furthermore, workflow layouts with copyspace allow for annotation. Complex processes rarely fit entirely inside a shape. Having designated areas for explanatory notes prevents clutter inside the diagram itself, maintaining visual hygiene and readability.
Practical Application: From Download to Delivery
Understanding the theory is essential, but practical application drives results. Here is a recommended approach for integrating these assets into your next project:
- Audit Your Content First: Never choose a template based solely on aesthetics. Map out your content in a document first. Do you have exactly five steps? Is your roadmap linear or cyclical? Let the content dictate the form.
- Customize Consistently: When editing EPS or SVG files, establish a color palette and font pairing before you begin. Uniformity across your slides builds trust and brand recognition.
- Leverage Layers: Professional vector templates are organized into logical layers. Lock the elements you aren't editing to prevent accidental shifts. Use the layer structure to toggle visibility for different variations of the same chart.
- Export Strategically: Only use JPG/PNG for final delivery. Always keep a master vector file. Requirements change, and having an editable source file saves hours of recreation time later.
Common Misunderstandings in Business Visualization
Even with excellent templates, users often fall into traps that undermine their effectiveness. One frequent error is treating the template as a finished product rather than a starting point. Templates are generic by design; your value add is specificity. Replace placeholder text with concrete data, real dates, and actionable insights.
Another misunderstanding involves complexity. There is a tendency to believe that more detail equals more professionalism. In data visualization, the opposite is usually true. If your 5-step process actually requires 12 sub-steps to explain, do not cram them into a 5-step template. Either simplify the message or choose a different layout entirely. The goal of a process timeline chart or workflow diagram is to reduce cognitive load, not to serve as comprehensive documentation. Use the visual for the overview and link to detailed documents for the deep dive.
Conclusion: Empowering Communication Through Design
The integration of business vector infographic templates into your communication toolkit represents a shift toward more empathetic, audience-centered design. Whether you are utilizing a creative roadmap to inspire a team, a 5-step visualization to clarify a methodology, or a workflow layout to optimize operations, these tools bridge the gap between raw data and human understanding.
By mastering the use of scalable vector formats, respecting the power of whitespace, and choosing layouts that align with your narrative structure, you transform standard presentations into persuasive visual experiences. Remember that the ZIP file containing EPS, JPG, PNG, and SVG assets is not just a collection of graphics; it is a flexible system designed to adapt to your unique business needs. In an era defined by information overload, the ability to present clear, beautiful, and structured visual data is not merely a soft skill—it is a competitive advantage.