Educational Sequential Infographic: Designing for Clarity and Retention
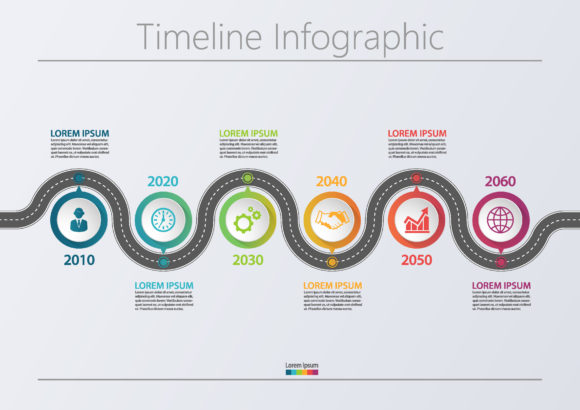
Visualizing complex information is one of the most effective ways to ensure your audience understands and retains your message. An educational sequential infographic serves as a visual roadmap, guiding viewers through a specific process, timeline, or workflow in a logical order. Whether you are an educator explaining a scientific cycle, a marketer outlining a customer journey, or a corporate trainer detailing onboarding procedures, this format transforms abstract concepts into digestible steps. The primary appeal lies in its ability to reduce cognitive load; instead of parsing dense paragraphs, the viewer’s eye naturally follows a predetermined path from point A to point B.
However, the effectiveness of these visuals depends entirely on execution. Many professionals and creators download templates expecting instant results, only to find their final presentation lacks impact. This usually stems from treating the template as a finished product rather than a structural foundation. To truly leverage an educational sequential vector infographic template, you must understand both the design principles behind it and the technical specifications of the files you are using. Avoiding common pitfalls during the selection and customization phases will save you hours of frustration and result in a far more professional outcome.
The Trap of Visual Overcrowding
The most frequent mistake when working with process timeline charts and workflow layouts is ignoring the necessity of negative space. Templates often come pre-filled with placeholder text and decorative elements to make them look attractive in a portfolio preview. When users begin editing, they tend to keep all these elements while adding their own content, resulting in a cluttered composition that defeats the purpose of sequential learning.
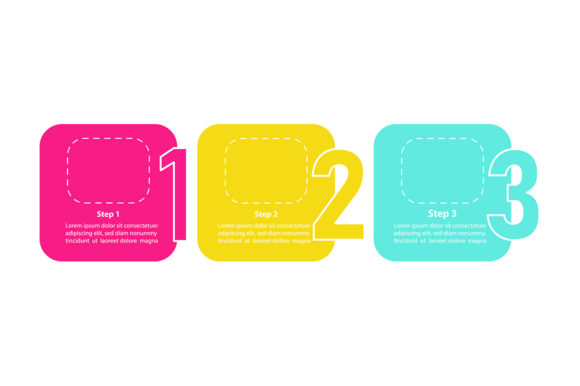
In educational design, whitespace is active, not passive. It creates the breathing room necessary for the brain to process one step before moving to the next. If your three-step data visualization feels cramped, the viewer will likely disengage before reaching the final stage. Before finalizing your design, audit your copyspace. Ensure there is adequate padding around text boxes and icons. If you have to reduce font size below 18pt for a projected presentation or 12pt for a handout just to fit the content, you have too much text. Edit your copy ruthlessly. The infographic should summarize the concept, not replicate the lecture notes. Use the designated text areas as anchors, but feel empowered to delete non-essential graphical flourishes if they compete with your core message.
Understanding Vector Versus Raster Limitations
A significant source of dissatisfaction arises from misunderstanding file formats. When you acquire a ZIP file containing EPS, JPG, PNG, and SVG assets, it is crucial to know which one to use for your specific medium. A common error is using the JPG or PNG version for print materials or large-scale displays. These raster formats have fixed resolutions; stretching them leads to pixelation and blurriness that undermines your credibility as a professional.
Always prioritize the EPS or SVG files for any editable or scalable work. These vector formats allow you to resize the educational sequential infographic infinitely without quality loss. They also permit color manipulation and element separation within software like Adobe Illustrator or free alternatives like Inkscape. The JPG and PNG files included in the package are typically intended for quick previews, web thumbnails, or situations where vector editing is impossible. Using a raster image for a corporate presentation slide that will be projected on a 4K screen is a preventable quality failure. Always verify your source file type before investing time in customization.
Maintaining Logical Flow in Three-Step Visualizations
Sequential infographics rely on implied motion. The viewer must instinctively know where to look next. A subtle but damaging mistake occurs when designers alter the layout structure without respecting the original directional cues. For example, if a template uses arrows or connecting lines to guide the eye left-to-right, changing the orientation of text boxes or removing connectors can break the narrative flow.
This is particularly critical in three-step data visualizations, where the relationship between stages is often causal or chronological. If Step 2 visually appears disconnected from Step 1 due to poor alignment or inconsistent styling, the educational value diminishes. When customizing your workflow layout, maintain consistent alignment grids. Ensure that transition elements (arrows, lines, dotted paths) clearly bridge the gap between stages. Test your design by squinting at the screen; if the directional flow isn't immediately apparent in this blurred state, your hierarchy needs adjustment. The goal is intuitive navigation, not a puzzle.
Color Consistency and Accessibility
Corporate presentation design elements often feature bold, trendy color palettes that may not align with your brand or accessibility standards. Blindly adopting the template's default colors can create a disjointed experience, especially if the infographic sits alongside other branded materials. More importantly, low-contrast color combinations can render your content unreadable for visually impaired audiences.
Before applying color, check contrast ratios against WCAG guidelines. Ensure that text stands out clearly against background shapes. In sequential designs, color often serves a functional role, such as differentiating steps or indicating status. Maintain this semantic consistency throughout. If blue represents "planning" in step one, do not switch it to green in step three unless the meaning changes. Create a master color style in your vector editor before recoloring individual elements to ensure uniformity across the entire educational sequential vector infographic template.
Evaluating Template Quality Before Download
Not all templates are created equal, and selecting the wrong one can lead to wasted budget and time. Before downloading or purchasing, evaluate the asset based on practical usability rather than aesthetic appeal alone. Check the layer organization in the preview images. Well-designed templates have clearly labeled layers (e.g., "Background," "Icons," "Text," "Connectors"). Poorly organized files with generic labels like "Layer 1 Copy 5" will significantly slow down your editing process.
Additionally, verify the editability of key components. Some templates flatten icons or text into single objects, making it impossible to change specific elements without advanced tracing skills. Look for descriptions that confirm fully editable vectors and outlined fonts versus live text. While outlined text preserves appearance, live text allows for faster content updates. Knowing your own skill level and software capabilities should dictate which file structure you choose. A beautiful template that exceeds your technical capacity is ultimately useless.
- Check Layer Naming: Organized layers indicate professional construction and save editing time.
- Verify Font Licensing: Ensure included fonts are free for commercial use or easily replaceable.
- Assess Scalability: Confirm artboard sizes match your intended output (e.g., 16:9 for slides, A4 for print).
- Review Documentation: Good templates include help files or video tutorials for complex features.
Ultimately, an educational sequential infographic is a communication tool first and a design asset second. By prioritizing clarity over decoration, respecting technical file specifications, and maintaining logical visual flow, you transform generic templates into powerful learning aids. Take the time to audit your content density and test your design for accessibility. These deliberate choices distinguish professional-grade educational materials from amateur attempts, ensuring your audience receives the clear, structured guidance they need to succeed.