Designing an Effective Business Road Map Infographic
Visualizing strategy is often more challenging than defining it. A business road map infographic serves as the critical bridge between complex planning and clear communication, transforming abstract goals into a tangible journey. Unlike a standard Gantt chart or a simple calendar, a true road map tells a story of progression. It combines timeline elements with milestone markers to show not just when things happen, but how they connect to form a cohesive narrative. For designers, marketers, and entrepreneurs, mastering this visual format is essential for aligning teams and impressing stakeholders.
The power of a well-designed road map lies in its ability to simplify complexity without losing nuance. When utilizing modern diagram process templates or vector illustrations, the goal is to create a visual anchor that guides the viewer’s eye from point A to point B. This is particularly relevant in digital marketing and technology sectors where data presentation must be both accurate and engaging. The most effective infographics do not merely list dates; they illustrate momentum, dependencies, and strategic pivots through thoughtful layout and iconography.
Creative Interpretations of Timeline Elements
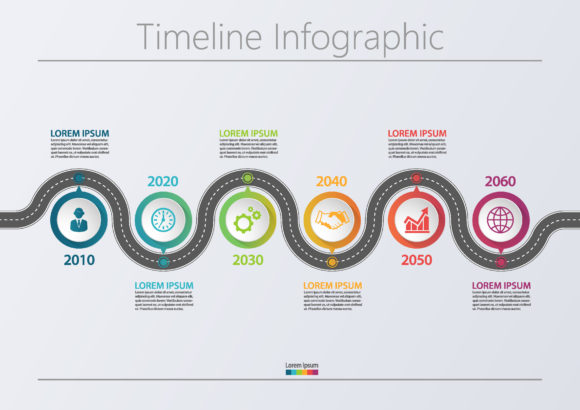
The traditional linear timeline is functional, but it can feel static. To make a business road map infographic truly resonate, consider how the path itself represents your organizational philosophy. The shape of the road dictates the psychological impact of the presentation. A straight horizontal line suggests stability, predictability, and efficiency. This works well for established corporations presenting quarterly earnings or compliance milestones. However, for startups or creative agencies, a winding path or an ascending spiral may better reflect the iterative nature of innovation and growth.
When working with abstract background templates, use negative space strategically. The empty areas around your timeline are just as important as the icons themselves. They provide breathing room that prevents cognitive overload. Instead of filling every pixel with data, allow the composition to guide focus. You might use a subtle gradient or a geometric pattern in the background to suggest forward motion without distracting from the key milestone elements. This balance ensures that the data presentation remains the hero while the design supports comprehension.
Selecting Icons That Communicate Context
Icons are the vocabulary of your infographic. Generic symbols dilute the message, while specific, meaningful icons enhance retention. When designing business road map timeline infographic icons, avoid overused clip art. Instead, develop a custom icon set or curate vectors that match your brand’s visual language. If your roadmap covers a product launch, use icons that represent development stages like wireframing, testing, and deployment rather than generic flags or checkmarks.
- Metaphorical Consistency: If you choose a "journey" metaphor, stick to it. Use compasses, maps, and terrain markers throughout. Mixing transportation icons with construction icons creates visual dissonance.
- Hierarchy Through Scale: Not all milestones are equal. Differentiate major achievements from minor tasks by varying icon size, color saturation, or stroke weight. This allows viewers to scan for high-level wins before diving into details.
- Color Coding Logic: Assign colors based on meaning, not just aesthetics. Blue might indicate completed phases, yellow for in-progress work, and grey for future projections. Maintain this legend consistently across all slides or pages.
Adapting Visuals for Diverse Audiences
A single road map rarely serves every stakeholder equally. Investors need to see market validation and ROI milestones. Internal teams need operational clarity and resource allocation. Clients want to understand deliverables and value realization. As a creator or consultant, your ability to adapt the same core data into different visual formats determines the utility of your work. A comprehensive master road map can be distilled into focused variations depending on the context of the presentation.
For digital marketing presentations, integrate data visualization directly into the timeline. Rather than placing charts next to the road map, embed key metrics within the milestone nodes. Show conversion rate improvements or traffic growth at specific campaign launch points. This contextualizes the data, proving that strategic actions led to measurable results. For educators or trainers teaching business strategy, focus on the decision points along the road. Highlight moments where the direction changed due to external factors, using the infographic as a case study tool rather than just a schedule.
Platform-Specific Design Considerations
The medium dictates the level of detail. A business road map infographic designed for a printed annual report can afford intricate details and smaller text because the viewer controls the pace. Conversely, a slide deck version requires bold typography and simplified visuals readable from a distance. Social media adaptations demand vertical cropping and modular segments that stand alone as individual posts while still feeling part of a larger series.
When creating vector illustrations for web use, ensure scalability. Test your designs at various zoom levels to confirm that thin lines do not disappear and text remains legible. Responsive design principles apply to infographics too; consider creating stacked vertical versions for mobile viewing alongside landscape versions for desktop. This flexibility ensures your strategic narrative is accessible regardless of how the audience consumes content.
Maintaining Clarity in Complex Data Presentations
The greatest risk in designing process diagrams is clutter. Enthusiasm for sharing information often leads to overcrowded layouts that defeat the purpose of visualization. Restraint is a professional skill. Before adding another element to your business road map infographic, ask if it serves the primary narrative. If a milestone does not significantly alter the trajectory or outcome, consider removing it or grouping it under a broader phase label.
Organization extends beyond layout to information architecture. Group related milestones into distinct phases or sprints. Use visual dividers, background shading, or connecting brackets to create logical chunks. This technique, known as chunking, helps the brain process information more efficiently. Label these phases clearly so viewers can orient themselves instantly. A well-structured road map allows a user to find their current position and understand immediate next steps without needing a guided tour.
Ensuring Originality and Brand Alignment
While templates provide excellent starting points, relying on them exclusively can make your work look generic. Customize abstract backgrounds and modify pre-made icons to inject personality. Adjust curve tensions, change corner radii, or introduce unique textures that align with your brand identity. Originality builds trust; it signals that thought went into the communication, not just the assembly.
- Audit Existing Assets: Review your current brand guidelines before opening design software. Ensure your road map colors, fonts, and styles complement existing collateral.
- Iterate on Feedback: Share early drafts with non-designers. If they cannot explain the timeline back to you accurately, the visual hierarchy needs adjustment.
- Document Your System: Create a style guide specifically for your infographics. Define rules for icon usage, spacing, and labeling to maintain consistency across future projects.
Ultimately, a successful business road map infographic is a tool for alignment. It transforms individual tasks into a shared vision. Whether you are a freelancer pitching a retainer, a startup founder seeking seed funding, or a department head managing change, the quality of your visual strategy matters. By focusing on clear narratives, purposeful iconography, and audience-centric adaptation, you turn static plans into dynamic instruments of progress. The best designs do not just show where you are going; they inspire confidence in the journey itself.