Transforming Complex Data with an Infographic Design Template
Staring at a spreadsheet full of quarterly results or a dense project roadmap can be overwhelming, not just for you but for anyone trying to understand the story behind the numbers. This is where a high-quality infographic design template becomes an essential productivity tool rather than just a decorative asset. It serves as a pre-structured visual framework that allows creators, marketers, and business owners to translate raw information into digestible, engaging narratives without needing advanced graphic design skills. Instead of building a layout from scratch, you are leveraging professional hierarchy, color theory, and spatial organization that has already been optimized for clarity.
The true value of these templates lies in their ability to bridge the gap between data analysis and visual communication. When you utilize a timeline infographic icon set or a modern diagram process layout, you aren't just making things look pretty; you are reducing cognitive load for your audience. In practical terms, this means your stakeholders spend less time trying to decipher what a chart represents and more time focusing on the strategic decisions that need to be made based on that data.
Real-World Applications for Business and Marketing
For digital marketers and small business owners, speed and consistency are often at odds with quality. You might need to present social media growth metrics to a client on Monday, explain a new sales funnel to your team on Wednesday, and create a blog post summarizing industry trends by Friday. A versatile business data visualization library solves the consistency problem while accelerating production.
- Client Reporting: Instead of sending a PDF full of tables, use a modular dashboard template to highlight key performance indicators (KPIs). Visualizing year-over-year growth with a clean vector chart makes success tangible and justifies retainer fees more effectively than text alone.
- Sales Enablement: Sales teams often struggle to explain complex product ecosystems during pitches. A technology-focused process diagram can illustrate how different software integrations work together, turning a confusing technical explanation into a simple, linear visual flow that prospects can grasp instantly.
- Content Marketing: Blog posts with original graphics receive significantly more engagement. Using abstract background templates with milestone elements allows bloggers to create featured images and inline graphics that break up text, improve SEO dwell time, and encourage social sharing without hiring a designer for every article.
In these commercial scenarios, the template acts as a force multiplier. It allows non-designers to maintain brand professionalism while freeing up budget for other critical areas like ad spend or product development.
Educational and Internal Communication Use Cases
Beyond external marketing, infographic templates play a massive role in internal operations and education. Corporate trainers, HR professionals, and educators frequently face the challenge of teaching abstract concepts or compliance regulations that are notoriously dry. A well-designed timeline infographic can transform a standard operating procedure (SOP) from a document nobody reads into a visual guide that employees actually reference.
Consider an onboarding scenario for a tech startup. New hires need to understand the company’s history, product evolution, and future roadmap. Rather than a lecture, an interactive-style vector presentation using milestone elements creates a narrative arc. It helps new team members visualize their place within the organization's journey. Similarly, educators teaching data literacy can use editable chart templates to demonstrate how different visualization types (bar vs. line vs. pie) affect data interpretation, providing students with hands-on experience in visual rhetoric.
Freelancers and Solopreneurs: Professionalism on a Budget
For freelancers and solo consultants, perception is reality. You may have the expertise of a senior agency director, but if your deliverables look amateurish, clients will question your rates. Investing in a premium infographic design template package is one of the highest ROI purchases a solopreneur can make. It provides immediate access to enterprise-grade aesthetics.
When proposing a new project, using a polished Gantt chart or process diagram signals organizational maturity. It tells the prospective client that you have established systems and workflows. Furthermore, because these assets are often vector-based, they scale perfectly from a mobile-friendly proposal deck to a large-format printed report, ensuring you always look sharp regardless of the medium.
Selecting the Right Assets for Your Specific Needs
Not all templates are created equal, and choosing the wrong one can actually hinder your workflow. Before downloading or purchasing, it is crucial to evaluate the asset against your specific technical and creative requirements. The most beautiful template is useless if it doesn't fit your actual content volume or software ecosystem.
- Data Density Compatibility: Assess the amount of information you typically present. Some modern diagram templates are designed for minimalism and high-level overviews, featuring only three or four data points. If you need to display twelve months of financial data, a minimalist template will require extensive modification. Look for "data-rich" or "dashboard" specific templates if your content is dense.
- Editability and Format: Ensure the file format matches your skillset and software. Vector formats like AI, EPS, or SVG are ideal for print and infinite scaling but require Adobe Illustrator or similar tools. If you work primarily in PowerPoint, Canva, or Figma, prioritize templates native to those platforms to avoid conversion headaches.
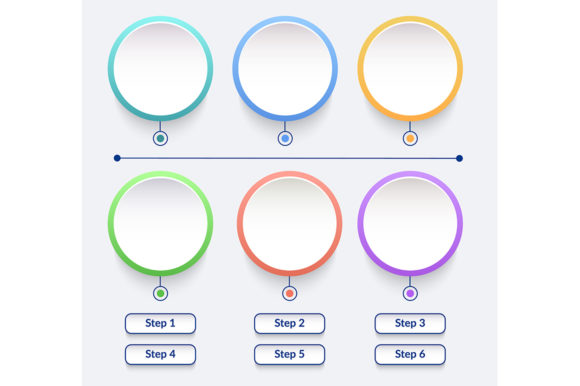
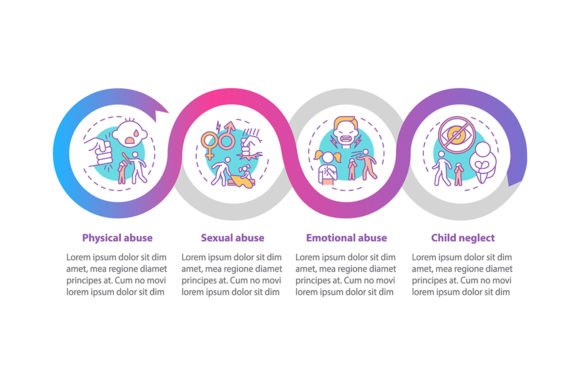
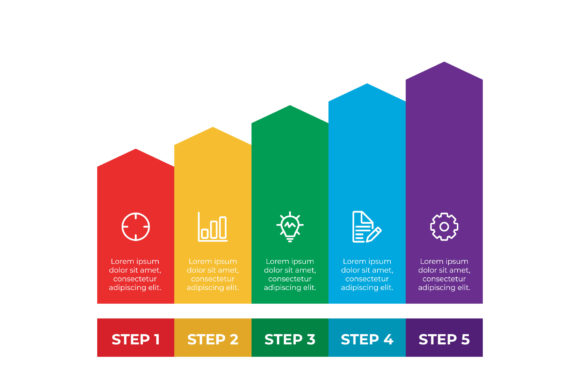
- Visual Metaphor Relevance: Avoid forcing content into an inappropriate metaphor. A funnel graphic implies reduction or filtering, while a circular process diagram implies continuity. Using a timeline icon set for a non-linear concept confuses viewers. Choose abstract backgrounds and structural layouts that logically support your message rather than distracting from it.
- Licensing and Usage Rights: Always verify the license type. Personal licenses are fine for hobbyists, but if you are creating client deliverables or selling digital products, you likely need an extended commercial license. Ignoring this can lead to legal issues down the road.
Customization Strategies for Authentic Results
The biggest risk when using pre-made assets is ending up with generic-looking content that screams "stock template." To maintain authenticity and adhere to E-E-A-T principles (Experience, Expertise, Authoritativeness, and Trustworthiness), you must treat the template as a starting point, not a final destination.
Start by adjusting the color palette to match your specific brand guidelines strictly. Do not rely on the default colors included in the download. Next, replace placeholder icons with custom illustrations or photography that reflects your actual industry context. Generic silhouettes of people shaking hands feel impersonal; photos of your actual team or specific product screenshots build trust.
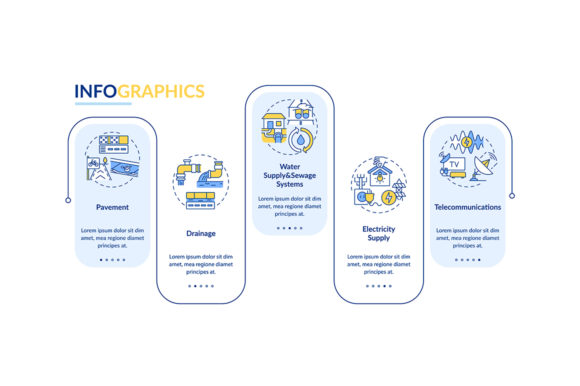
Finally, edit the copy within the template ruthlessly. Templates often contain filler text like "Lorem Ipsum" or generic headers like "Strategy Phase 1." Replace these with specific, actionable language relevant to your audience. If the template includes a section for "Market Analysis," but your data is actually about "User Retention," change the label. Accuracy in terminology demonstrates expertise, whereas leaving default labels suggests a lack of attention to detail.
Maximizing Impact Across Digital Platforms
Different platforms demand different adaptations of your infographic assets. A vertical timeline infographic designed for Pinterest or Instagram Stories will fail on LinkedIn, where horizontal landscapes or carousel documents perform better. When working with vector elements, take advantage of their scalability to export multiple variations from a single master file.
For web presentations, consider breaking a long-form infographic into smaller, focused segments. This improves page load speeds and allows users to engage with bite-sized pieces of information. On social media, animated versions of static templates often see higher reach. Many modern template packs include After Effects or Lottie files specifically for this purpose, allowing you to add subtle motion to data points without animating from scratch.
Ultimately, an infographic design template is a vessel for your expertise. Whether you are a teacher explaining history, a marketer showcasing ROI, or an entrepreneur pitching a vision, the goal remains the same: clarity. By selecting the right structural foundation and customizing it with genuine insight and accurate data, you transform a generic resource into a powerful communication asset that drives real understanding and action.