Visualizing Asset Monitoring Types: A Practical Guide to the Infographic Template
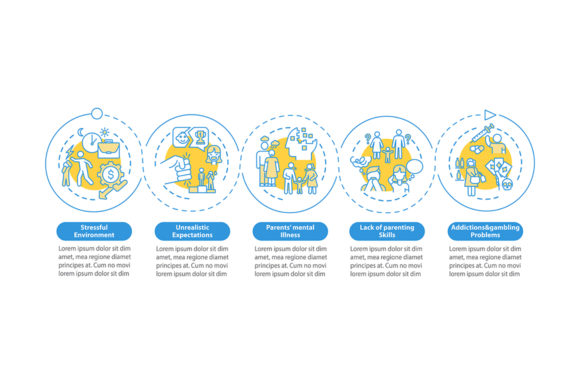
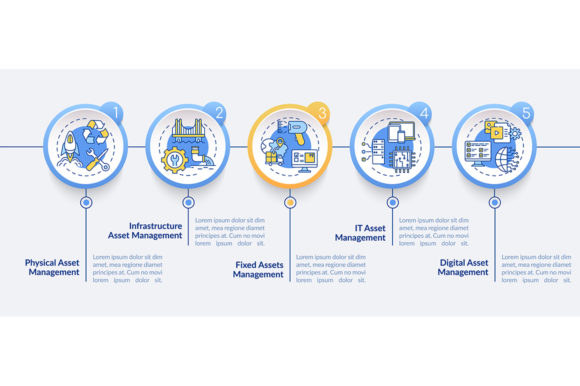
Managing physical assets and infrastructure requires more than just spreadsheets and maintenance logs; it demands clear communication. When you need to explain complex monitoring protocols to stakeholders, clients, or team members, the Asset Monitoring Types Infographic serves as an essential visual bridge. This vector-based template is designed specifically for professionals who need to translate technical data into an accessible narrative. Rather than overwhelming your audience with raw telemetry or sensor specifications, this design organizes information into a coherent five-step process timeline that highlights workflow efficiency and system reliability.
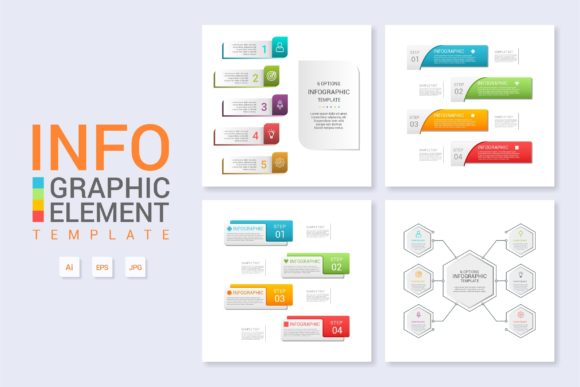
The true value of this resource lies in its versatility across different professional landscapes. Whether you are a facility manager presenting a quarterly review, an educator teaching industrial IoT concepts, or a marketer creating content for a B2B SaaS platform, the ability to visualize asset monitoring types transforms abstract data into actionable insight. The included ZIP file provides EPS, JPG, PNG, and SVG formats, ensuring that whether you are printing a large-format poster for a trade show or embedding a crisp graphic in a digital report, the quality remains uncompromised.
Streamlining Infrastructure Presentations for Stakeholders
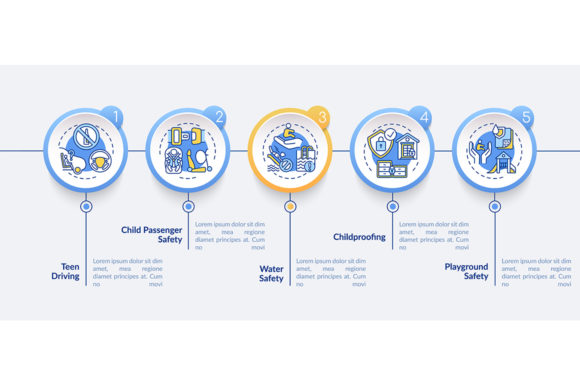
One of the most immediate applications for this infographic template is in corporate and municipal infrastructure reporting. Facility managers and operations directors often struggle to convey the scope of their monitoring systems to non-technical board members or city council representatives. A verbal explanation of predictive maintenance versus condition-based monitoring can easily get lost in translation. By utilizing the linear icon workflow layout, you can map out exactly how different asset types—from HVAC systems to heavy manufacturing equipment—are tracked throughout their lifecycle.
Consider a scenario where a logistics company needs to justify an investment in new sensor technology. Using the Asset Monitoring Types Infographic, the presenter can visually distinguish between real-time location tracking and environmental condition monitoring. The five-step data visualization allows the audience to follow the logical progression from data collection to decision-making. Instead of seeing a budget line item, stakeholders see a structured process that mitigates risk and ensures compliance. This visual clarity often shortens approval cycles because it reduces cognitive load, allowing decision-makers to grasp the operational benefits without needing an engineering degree.
Educational and Training Applications
Beyond the boardroom, this template is a powerful tool for educators and corporate trainers. Teaching asset management principles involves conveying multiple overlapping concepts simultaneously. Students and new hires must understand not only what monitoring types exist but also how they integrate into a broader maintenance strategy. The vector infographic template acts as a consistent visual anchor during lectures or onboarding sessions.
For vocational schools or university engineering programs, the SVG and EPS files allow instructors to modify the graphic to match specific curriculum modules. You might adapt the process timeline chart to focus solely on vibration analysis for one class, then switch to thermal imaging for another. Because the design elements are modular and vector-based, educators can create a suite of customized learning materials without hiring a graphic designer. This consistency helps students build mental models faster, as they become familiar with the visual language of asset monitoring rather than relearning a new diagram format for every topic.
Digital Content Creation and Technical Marketing
Marketers and content creators in the industrial tech space face a unique challenge: making dry, technical subjects engaging for digital audiences. Blog posts, whitepapers, and social media carousels about asset monitoring often suffer from high bounce rates when they rely too heavily on dense text. Integrating the Asset Monitoring Types Infographic into your content strategy breaks up text-heavy pages and increases dwell time.
The PNG and JPG formats included in the download are optimized for web use, making it easy to illustrate articles comparing different monitoring methodologies. For example, a freelance writer covering smart factory trends can use the workflow layout to visually summarize key takeaways for readers skimming on mobile devices. Similarly, B2B marketers can repurpose the linear icons as standalone social media graphics or email newsletter headers. This flexibility turns a single design asset into a multi-channel content engine, helping brands establish authority and improve SEO through rich media engagement without the recurring cost of custom illustration.
Consulting and Proposal Development
Independent consultants and small business owners frequently need to produce professional-grade proposals with limited resources. When pitching asset management solutions to prospective clients, your proposal needs to look as polished as those from major firms. The Asset Monitoring Types Infographic template levels the playing field by providing enterprise-quality design elements that can be rapidly customized.
In a consulting context, the five-step process timeline is particularly effective for demonstrating your methodology. You can annotate the chart to show exactly where your services fit into the client’s existing workflow. Perhaps your expertise lies in step three—data analysis—or step five—maintenance execution. Visualizing this placement helps clients understand your specific value proposition within the larger ecosystem. Furthermore, because the file includes editable vector formats, you can adjust colors and labels to match the client’s branding, adding a layer of personalization that generic stock photos simply cannot achieve.
Key Considerations Before Implementation
While this template offers significant advantages, users should approach it with a strategic mindset to maximize its effectiveness. Before downloading or applying the Asset Monitoring Types Infographic, consider the specific narrative you need to convey. The five-step structure is excellent for linear processes, but if your monitoring system operates cyclically or involves complex feedback loops, you may need to adapt the layout creatively. Understanding the limitations of the template prevents forced fits that could confuse rather than clarify.
Technical compatibility is another practical factor. Ensure you have access to vector editing software like Adobe Illustrator or compatible open-source alternatives before purchasing. While the raster files (JPG/PNG) are ready for immediate use, the true power of the template lies in the editable EPS and SVG files. If you lack design skills or software, verify whether the seller offers customization services or if the file structure is simple enough for basic editing tools. Additionally, review the licensing terms carefully. Commercial use for client deliverables typically requires a different license tier than personal or educational use. Clarifying these details upfront avoids legal complications and ensures your project stays on schedule.
Matching Design to Data Complexity
Finally, assess the density of information you intend to present. Infographics are meant to simplify, not compress entire technical manuals into a single image. Use this template to highlight high-level categories and workflows, but be prepared to link out to detailed documentation or appendices for granular specs. The goal is to provide a navigational map for your audience, not the entire territory. When used with this intentionality, the asset monitoring types vector infographic becomes more than just a pretty picture; it becomes a functional communication tool that drives understanding and action across diverse professional settings.
Ultimately, the decision to use this template should be driven by your audience's needs rather than aesthetic preference alone. Ask yourself whether a visual representation will genuinely reduce friction in communication. In fields as technical as infrastructure and asset management, the answer is frequently yes. By leveraging professional design elements, you respect your audience's time and intelligence, delivering complex information in a format that respects the way people actually consume and process technical content today.